Plot Builder Workflow
Overview
In this workflow, we’ll guide you through building plots for a survival count cruise on a two-year-old stand, involving the setup of sample plots to count and record surviving trees. Detailed step-by-step instructions will help you select representative plot locations, conduct tree counts, and analyze the data to assess reforestation success and inform future management decisions.
Need More Help?
For personalized assistance, speak with a customer service representative or join our monthly training session.
Workflows
Plot Building
Step 1: In the Map View, select the feature you wish to build plots for. Ensure you select the Stands option, not the Org.
Step 2: Select the Tools Ribbon in the Menu Bar.
Step 3: In the Tools Ribbon, select the Extensions tool. In the Extensions sub menu, select Plot Builder. The Plot Builder dialog window opens and the Set Starting Point tool becomes available in the Ribbon.
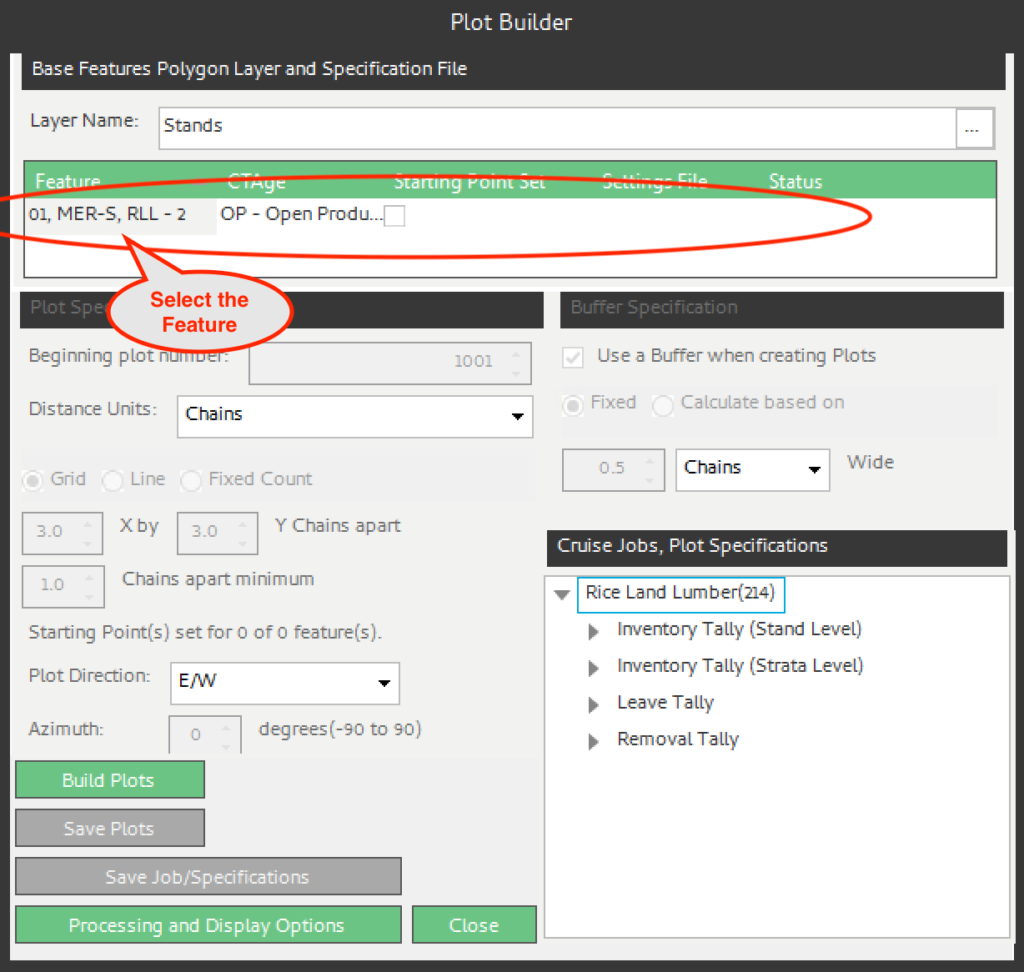
Step 4: In the Plot Builder dialog window, select the feature you wish to add Plot specifications to.
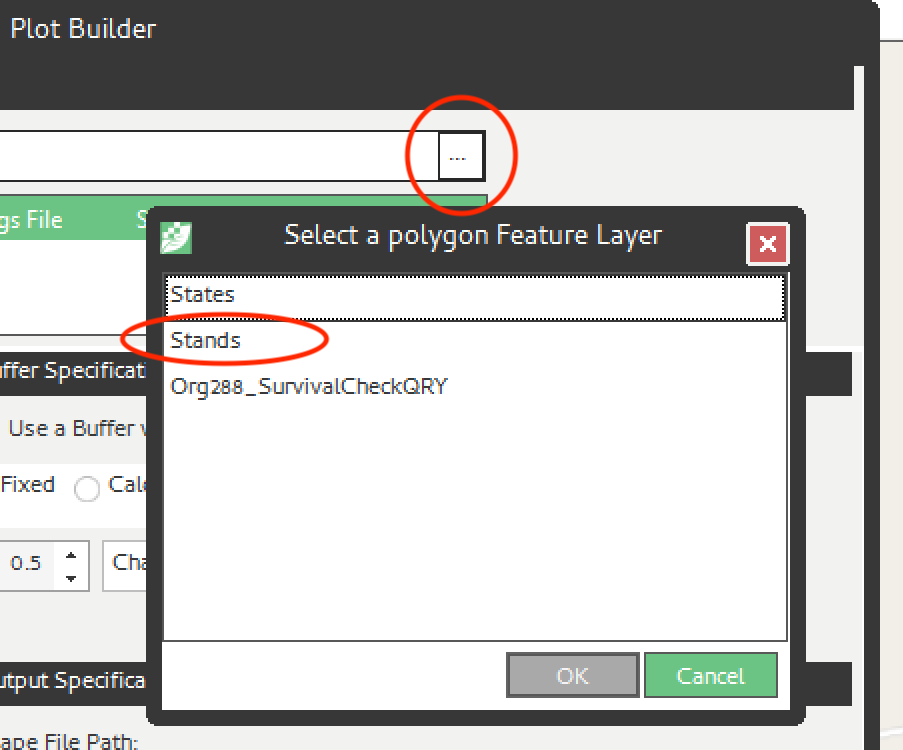
NOTE: If the window opens and there are no records displayed, ensure that the Layer Name at the top of the Plot Builder window says “Stands.” To fix this, click the ellipses to the right of the text box. A popup will display the options Users can choose from. Select Stands and click <OK>. A record will appear.
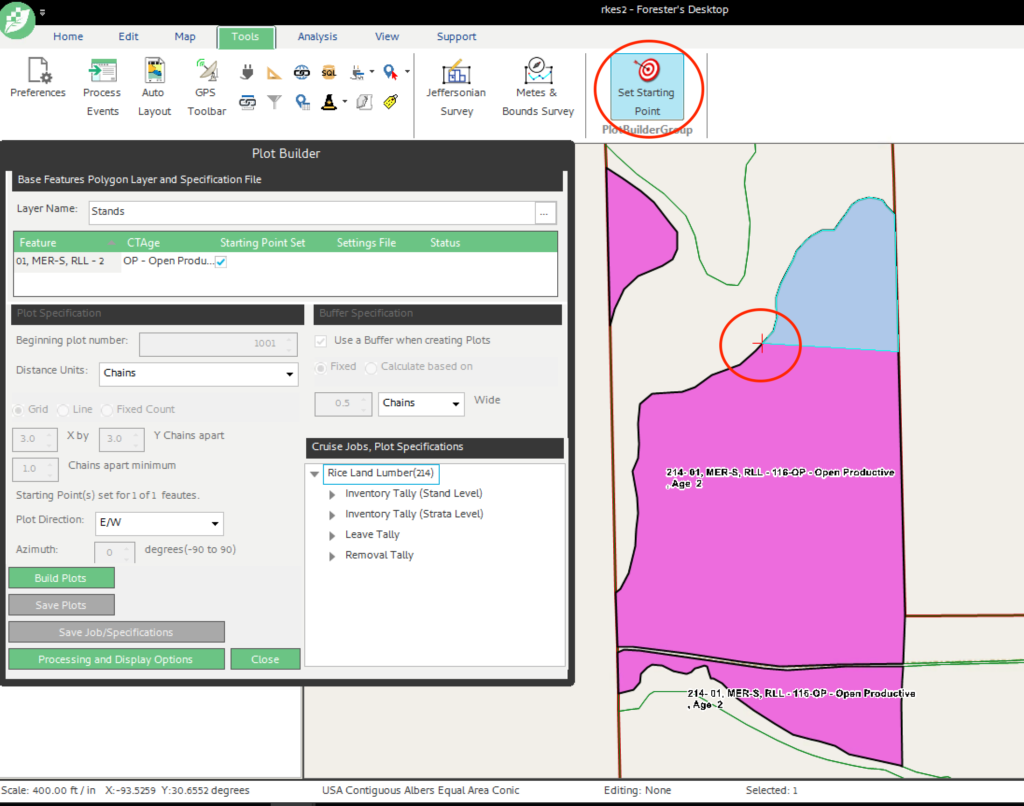
Step 5: Set a Starting Point where the plots should begin. Note: Depending on the Set Starting Point, the plots will differ. Users can relocate the point by simply clicking on the newly desired spot and selecting “Build Plots”.
- Click on the record. An option will pop up on the ribbon in the Tools tab to Set Start Point.
- Click the Set Starting Point button and a crosshair will replace your cursor.
- Click along the boundary of the selected area on the map to choose the start point.
Step 6: In the Cruise Jobs, Plot Specifications menu, select:
- Org
- Inventory Tally (Stand Level)
- 2016 Rice_mgmt
- 2016 Rice_mgmt1
- 2016 Rice_mgmt
- Inventory Tally (Stand Level)
Plot Specifications populate when user selects “2016 Rice_mgmt1”.
Step 7: Click the Feature Name of the record listed at the top of the window. In the Cruise Jobs, Plot Specifications menu, “grab and drag” the “2016 Rice_mgmt1” into the “Settings File” column for the selected feature. The Settings File column populates with the selected Cruise Job Plot specification file.
NOTE: If receiving a prohibit symbol, try using another Specification. This step will not run properly if a template is selected.
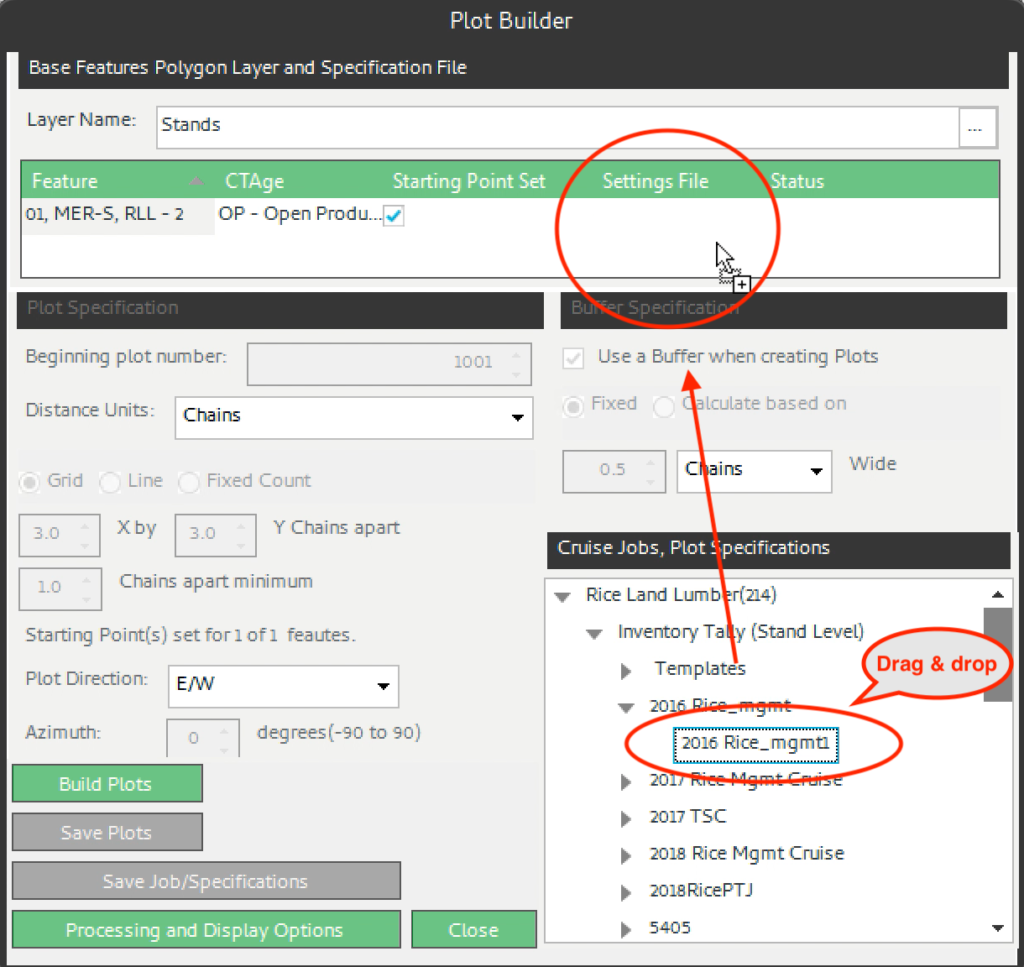
Step 8: In the Plot Specification Section, set values for the following:
- Distance Units: Chains
- Plot layout: select the radio button for Grid, Line, or Fixed Count as desired
- Select the # of Plots
- Indicate whether the plots should be evenly spaced or randomly spaced
- Set the Plot Direction
- Indicate how often to collect total heights
If desired, modify the processing and display options as well.
Step 9: Select <Build Plots>. Plots build in the Map View on the selected feature. Note: Users can adjust their plots and the settings of plots however they wish. Just click build plot sand they will renew with the new settings.
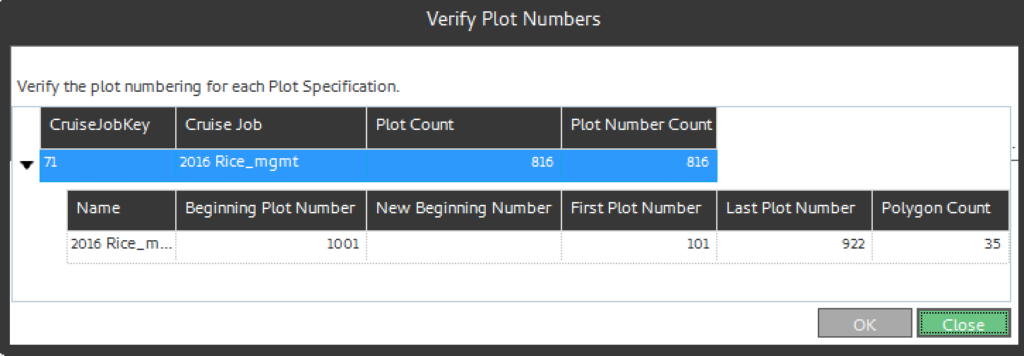
Step 10: Select <Save Plots> to add the plots to the Cruise Plots layer. The Verify Plot Numbers dialog window opens. Note: If the beginning plot number selected is already in use, then you will need to select a new beginning plot number here.
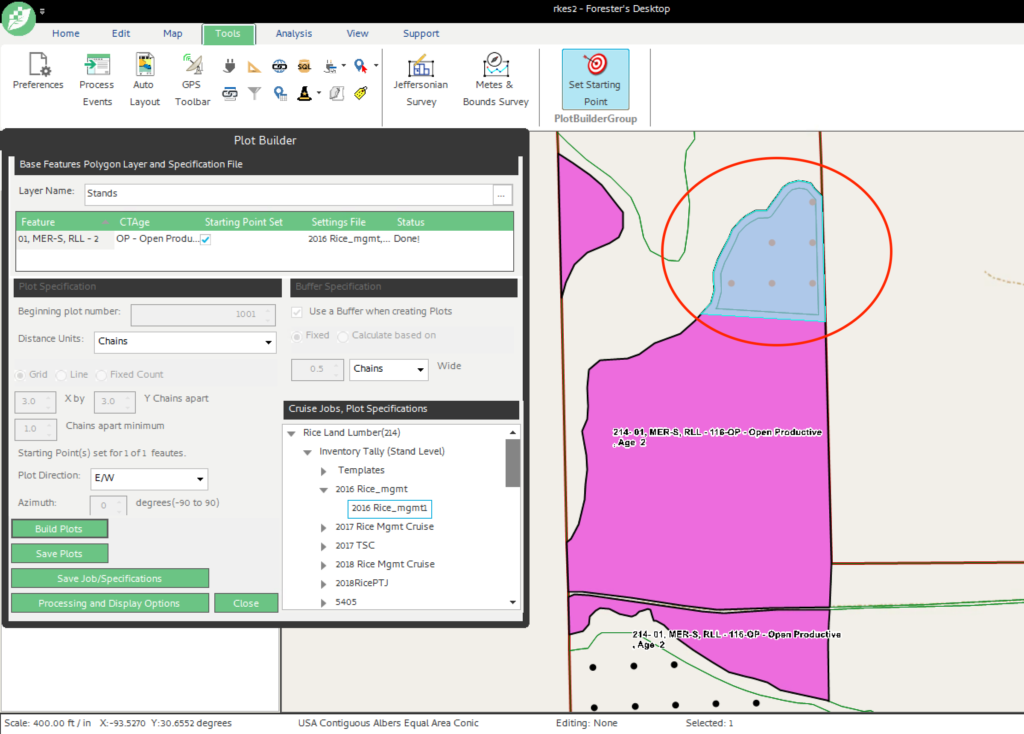
Step 11: Select <Close> to close plot builder and see your plots on the Cruise Plots layer. Plots save to the cruise plots layer.
